
Electronic Design and Family Site
Lazure LCD SWR & Power Meters
This
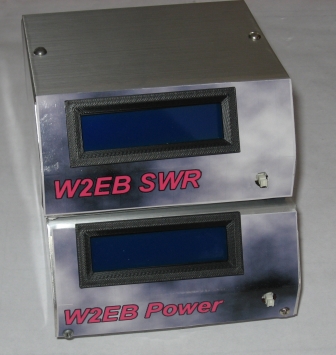

21 Nov 24 - Finally a "refresh" for this project. The frequency sensitivity of the original power meter, and the power limitations of the original SWR meter forced me to try again. I totally abandoned the Analog Devices log amps and used a more "tried and true" type of detector...the Stockton Bridge. I built one and tested the heck out of it until I knew exactly how it performed in a variety of situations. Then I built a "conversion & display" board set to convert the detector's voltage output into usable power and SWR measurements that display to an LCD. The main board employs an automatic divider that divides the input voltages, FWD and REV by 2 if they exceed about 4.5V, as determined by a separate (pre-divided) reference input. This helps protect the Arduino processor and extends the usable range of the meter. This latest iteration is the culmination of about 6 months of effort in this endeavor. Explore these pages and see what I ended up with...
-Bill Lazure
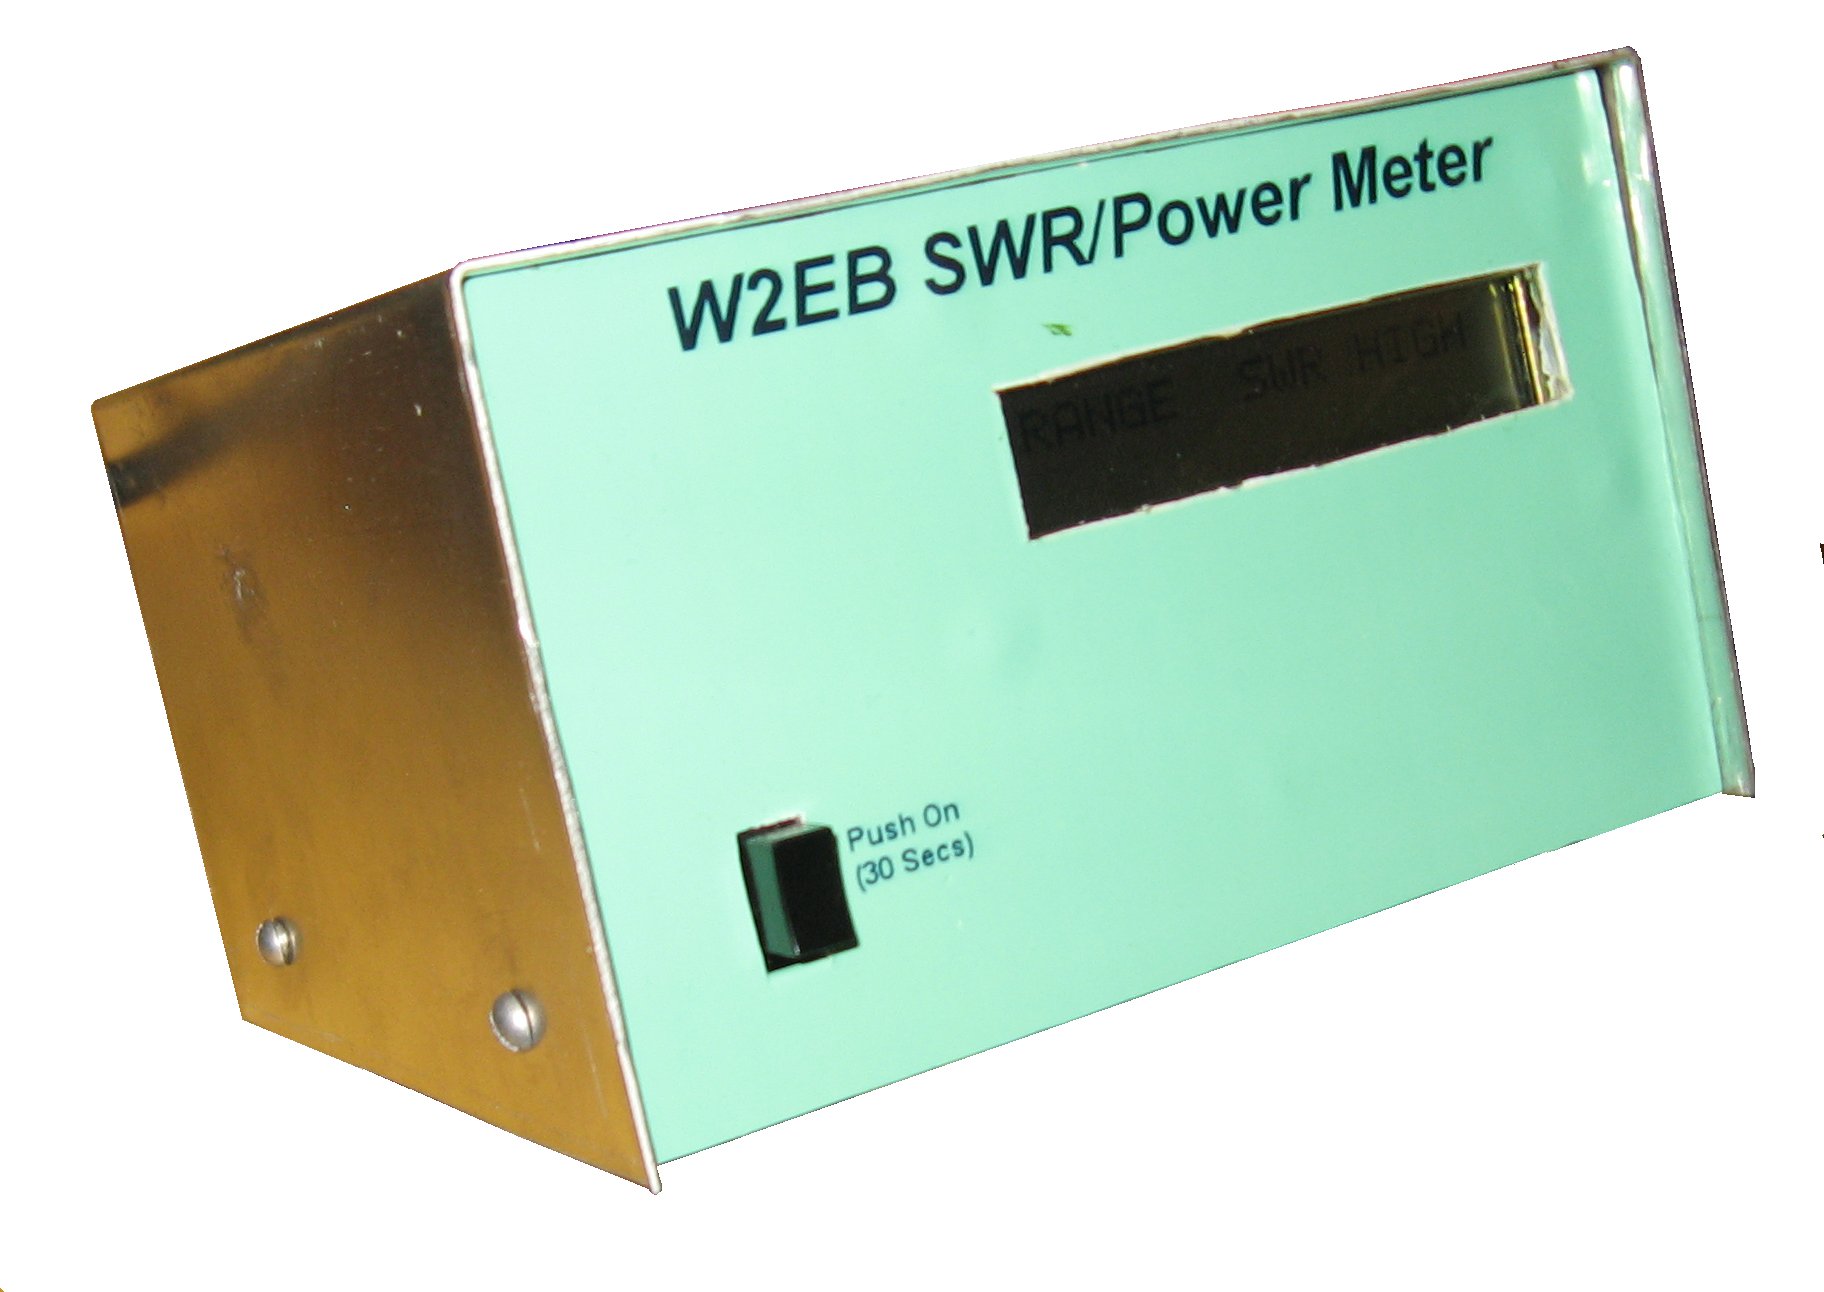
Originally I wanted a "Smallish" bench SWR & Power meter with a display unit and a separate pickup head. The separate pickup was to possibly allow me to mount the pickup well away from the display so I could "contain" the RF. Ultimately in terms of operating features, I simply wanted a reading of SWR and measured power with possibly a bar graph showing either/both.
The Updated objective:
The original meter was very frequency sensitive with readings horribly inaccurate from 80M to 10M. The SWR function also couldn't handle power higher than about 60W, at which point accuracy dropped off horribly.
Theory of Operation - Hardware Operation
Transmitter power is introduced into the pickup unit via its associated BNC jack. The load (antenna, tuner, or dummy load) is connected to the other side of the transformer primary via its associated BNC jack. The two transformers, develop voltages proportional to Forward and Reverse Power. These voltages are rectified by the two Schottky diodes and filtered by the various capacitors. The resultant DC voltages are fed into 2 stages of buffer amplifiers (actually only one stage is needed, the other is an artifact of a failed attempt at multiplying low-level input signal). The outputs of the buffers then feed the divider op amps that "can" divide high-level outputs based on the DC input of the reference op amp. The Outputs of these amplifiers feed three of the Analog to Digital Converter (ADC) inputs of the Arduino.
Theory of Operation - Software Operation
-The Arduino is the heart of the meter. It performs several functions: Controls the display, takes the ADC readings, performs SWR calculations, converts ADC "counts" into comparable power in watts, and converts both device's readings into a graphical representation for the bargraph.
SWR Meter
When initialized, the PIC initializes the LCD and programs special characters into it for the Bargraph. It then takes 20 separate SWR FWD and SWR REV readings and averages them. It then uses those two readings to compute SWR using the formula:
SWR = Vf+Vr/Vf-Vr, Vf = SWR FWD voltage and Vr = SWR REV voltage.
Once the SWR value is obtained it is written to the LCD using a template that is filled by the calculated digits. Finally, the computed SWR value is sent to the bargraph calculator which divides the count and completely fills each digit of the LCD by that number. The remainder is used to fill the last block of the bargraph with a number of vertical lines which correspond to the remainder.
Power Meter
20 consecutive power readings are taken from the FWD ADC and averaged. This is the method used to reduce "jitter" in the power reading.
Once an averaged reading is obtained, it is converted to voltage by multiplying by .00488. Then it is multiplied by the constant 1.414 and squared. The resultant amount is the direct power reading. This numeric amount is sent to the appropriate display template, are then sent to the LCD. Finally, the actual Power numeric is sent to the bargraph calculator which decides whether the amount is over 10 or under. If over, it is divided by 10 and a solid block is written for each 10. If the power is under 10, each full block corresponds to each single number (3 blocks for 3W, 4 blocks for 4W, etc) and is written to the LCD. The remainders are used to fill the last block of the bargraph with a number of vertical lines which correspond to the remainder.